
Dashboards
One board. Phone, laptop, the TV in the office.
Drag the widgets where they belong. Move the date once and every number follows. Give each person exactly the board they should see.
The grid
Built for reading across a room.
A four-column grid you rearrange by dragging. Gauges and number tiles for the headline figures, lines and bars for the trend, tables when you need the detail. Mobile keeps its own layout, so the phone view is not a squeezed desktop.
- Eleven chart types, including gauges that read against target
- A separate saved layout for mobile
- Live refresh, including realtime where the source supports it
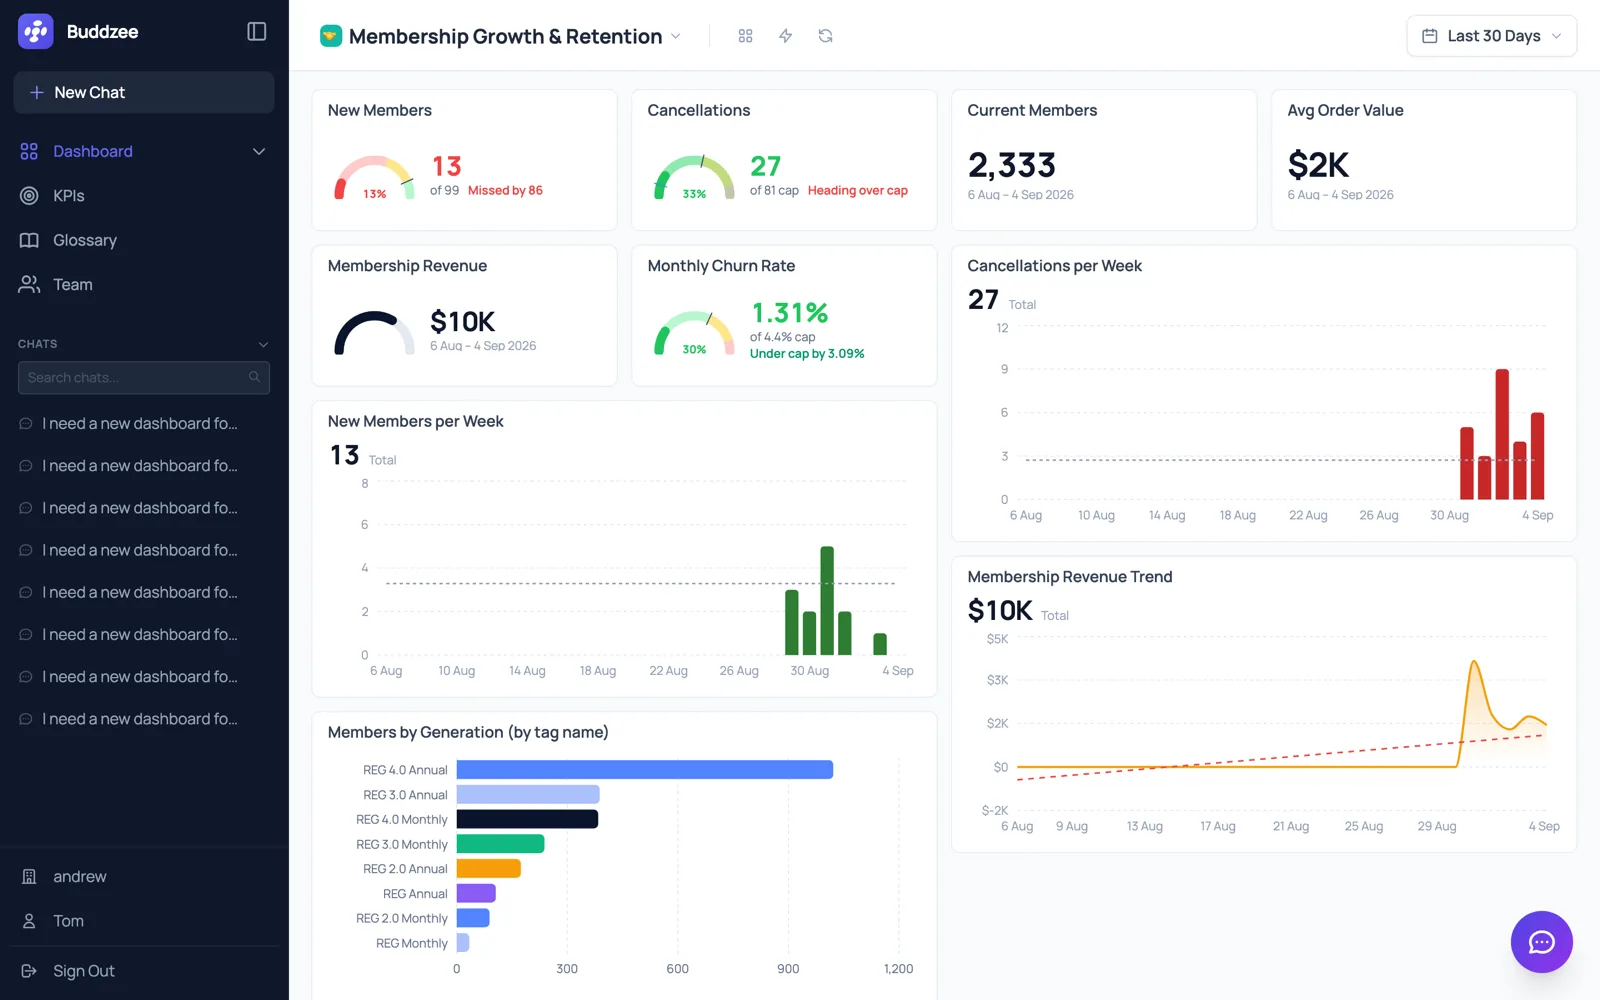
Period
Change the date once.
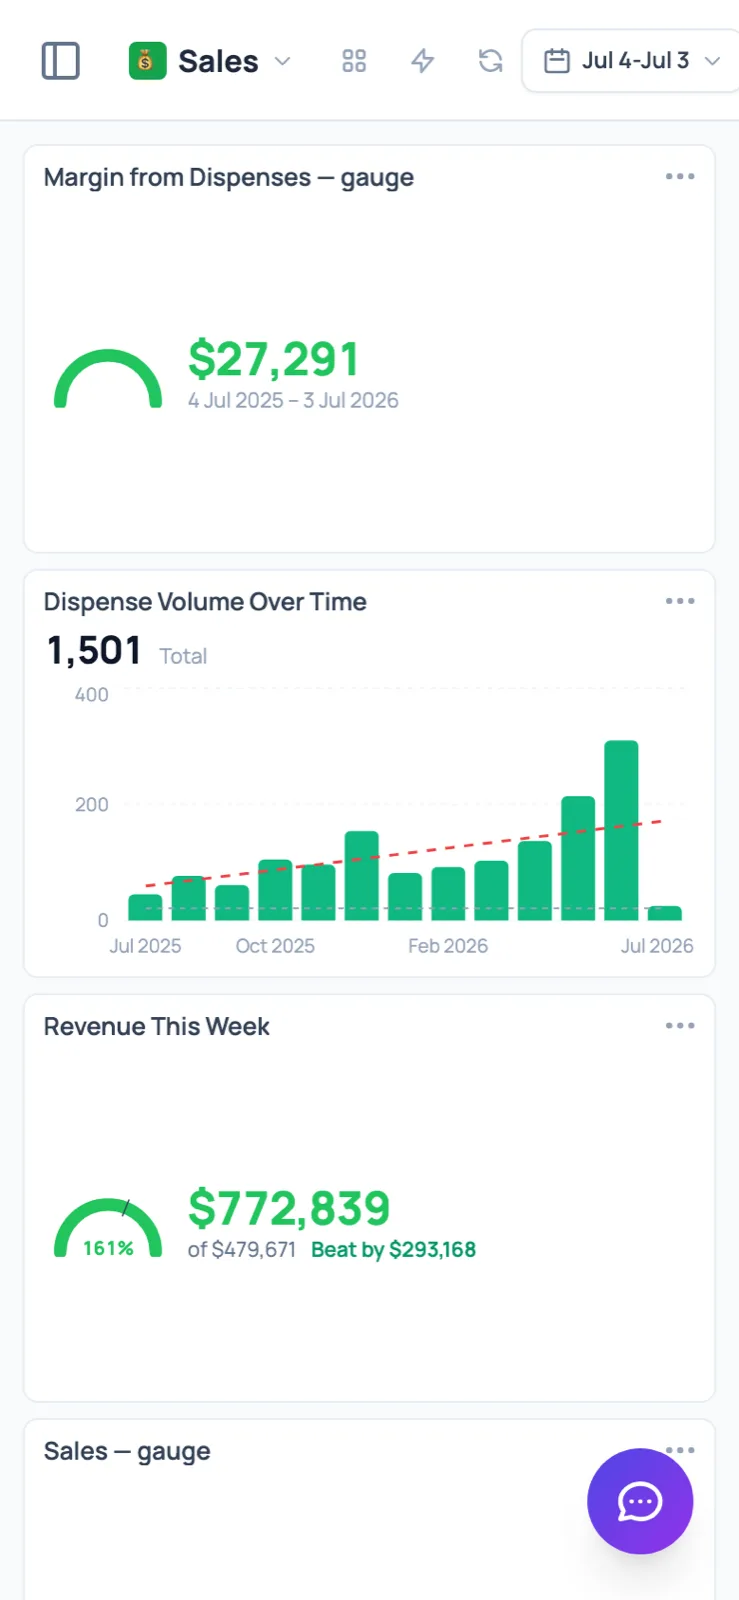
The period control at the top of the board drives every widget on it. Switch to last quarter and the gauges re-read against the quarter target, the charts re-bucket, and the comparisons follow.
- Presets, custom ranges, and reusable variables
- Charts re-bucket to suit the span you picked
- Timezone-aware, so “today” means your today
Who sees what
Not everyone should see the P&L.
Roles set what a person can do. Data scopes set which records they see. Shares hand one board to one person without opening the rest.
What they can do.
Owner, manager, viewer. Who can build, who can only read.
Which records they see.
A site manager sees their site. The figures re-aggregate for them; they never see the rest.
One board, one person.
Hand the bookkeeper the cash board without giving them the whole account.
See your numbers on a board.
Bring a question. We will build the board that answers it while you watch.