
Examples
Real boards, real numbers.
Every board here is a screenshot from a working Buddzee account, not a mockup. The numbers are what that business actually saw.
Clinics
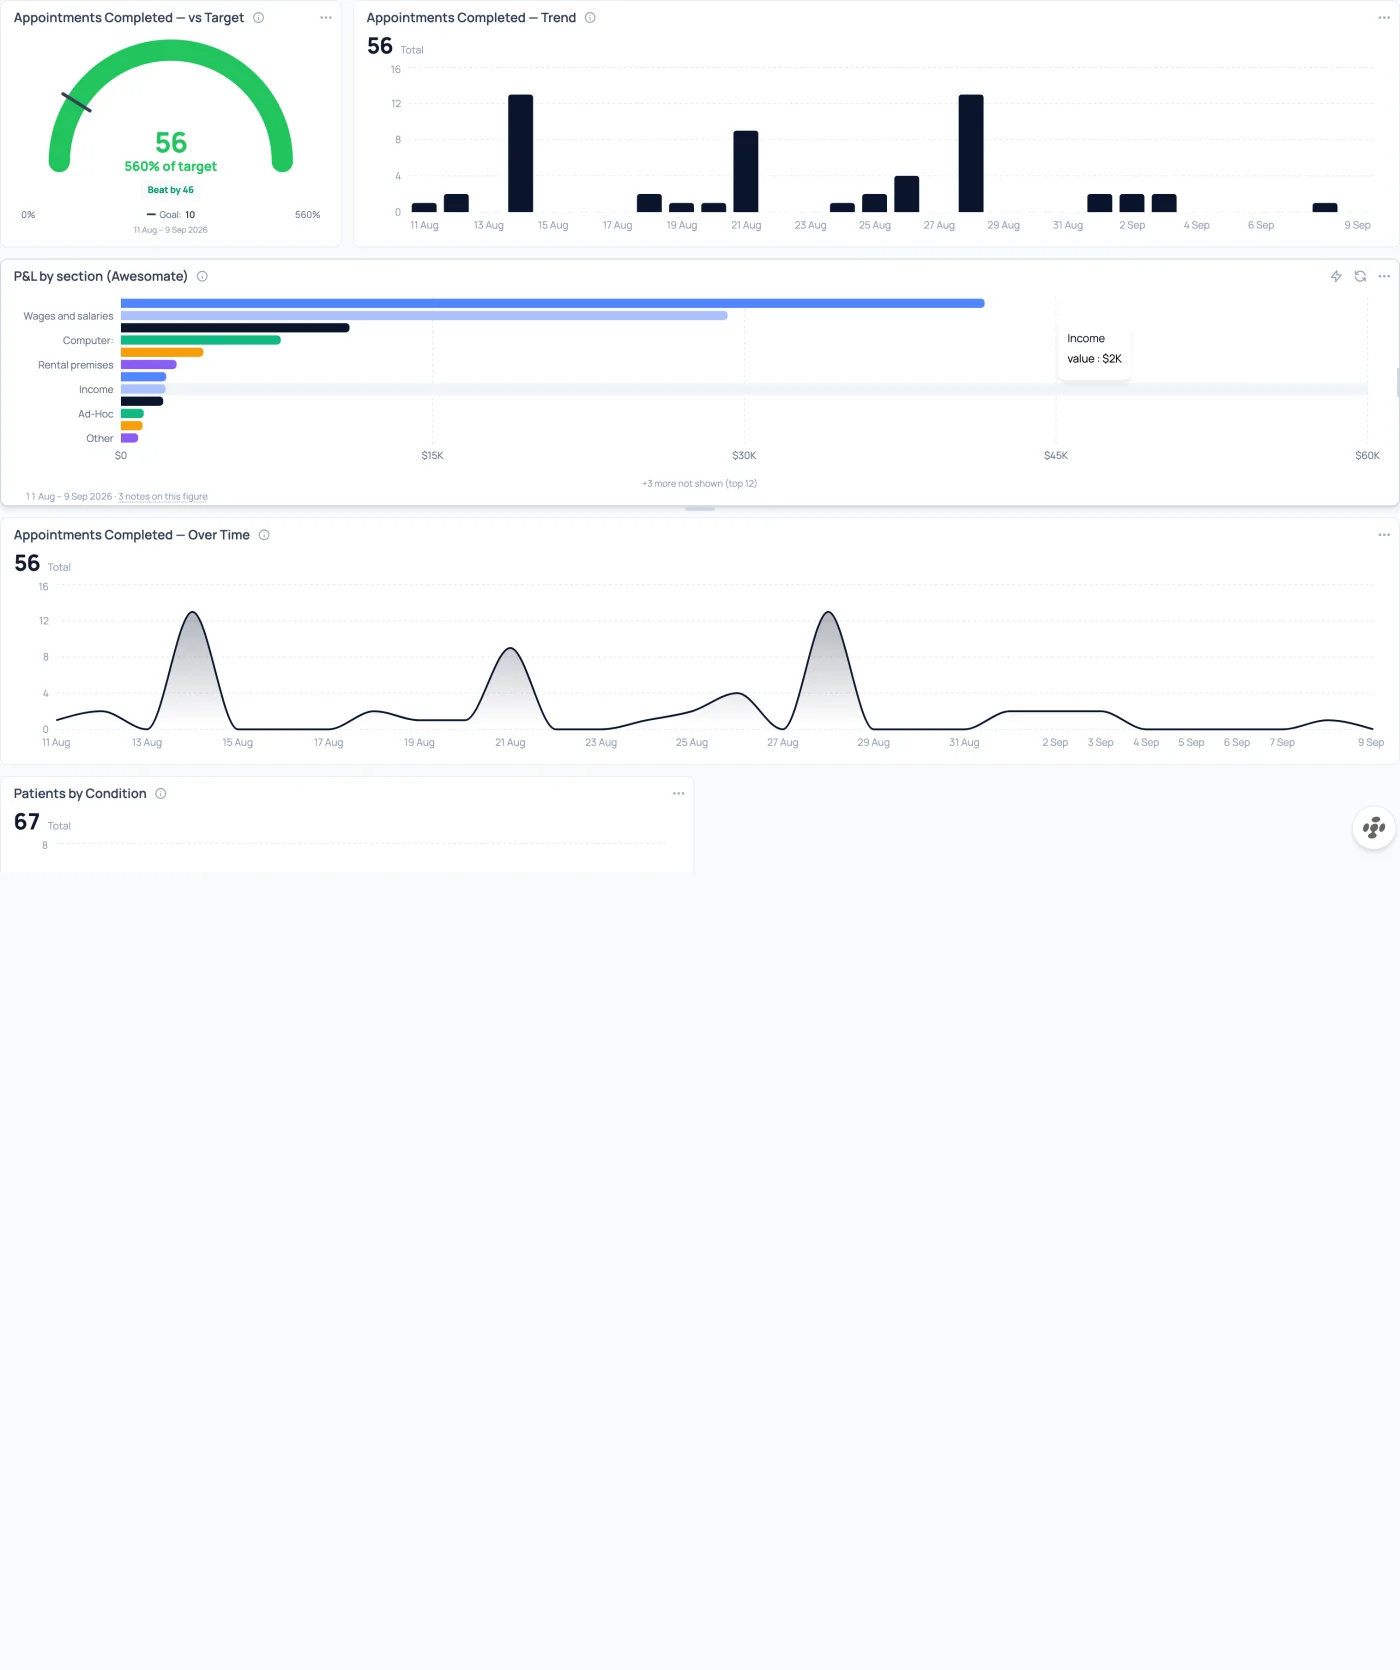
Appointments
Appointments completed against target, the trend over time, and the same figure broken down week by week. The board a practice manager opens first.
Clinics
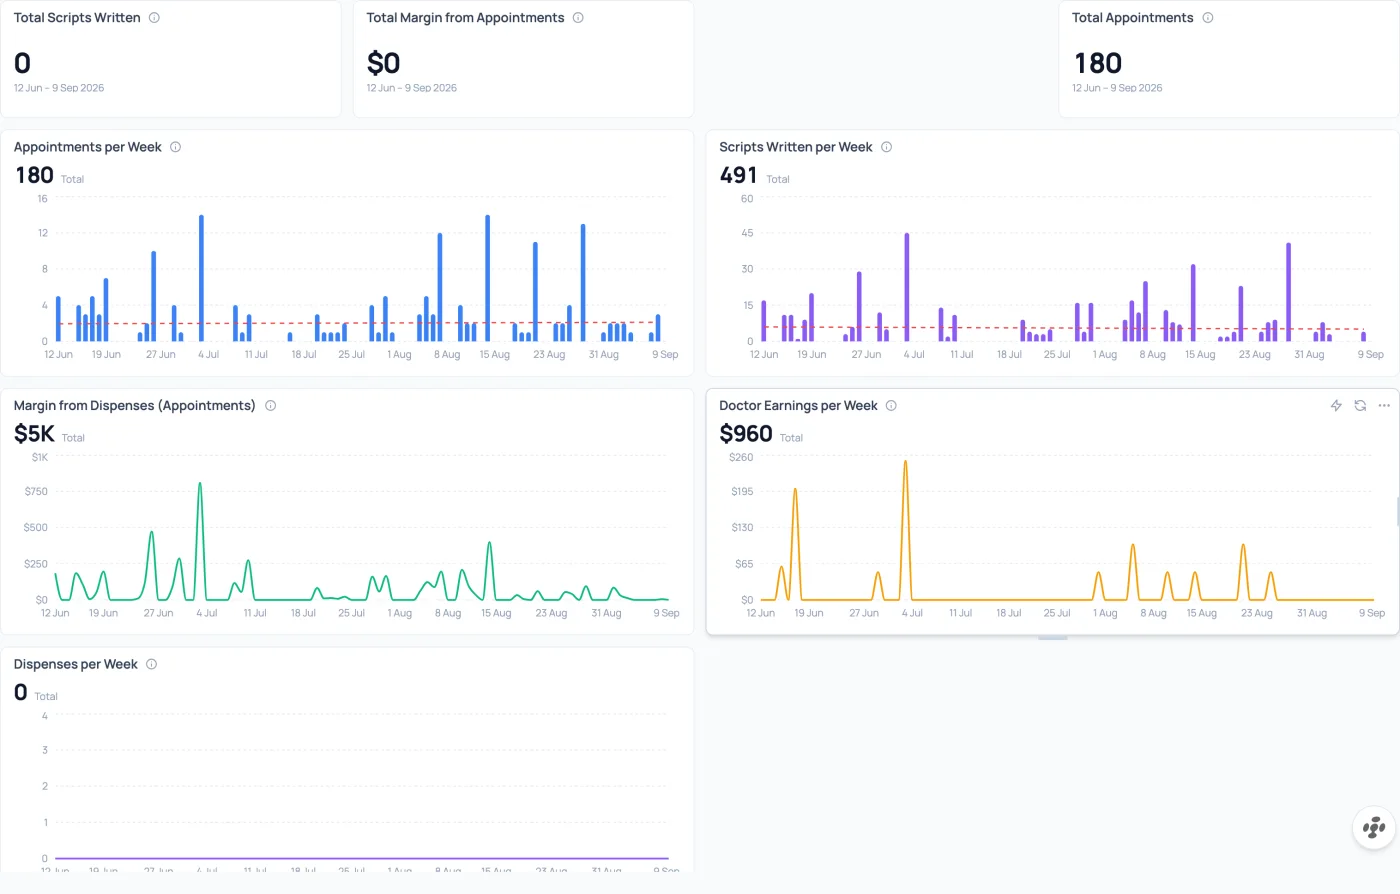
Practitioner performance
Scripts written, margin earned and appointments held, per practitioner. The conversation that used to need a spreadsheet.
Clinics
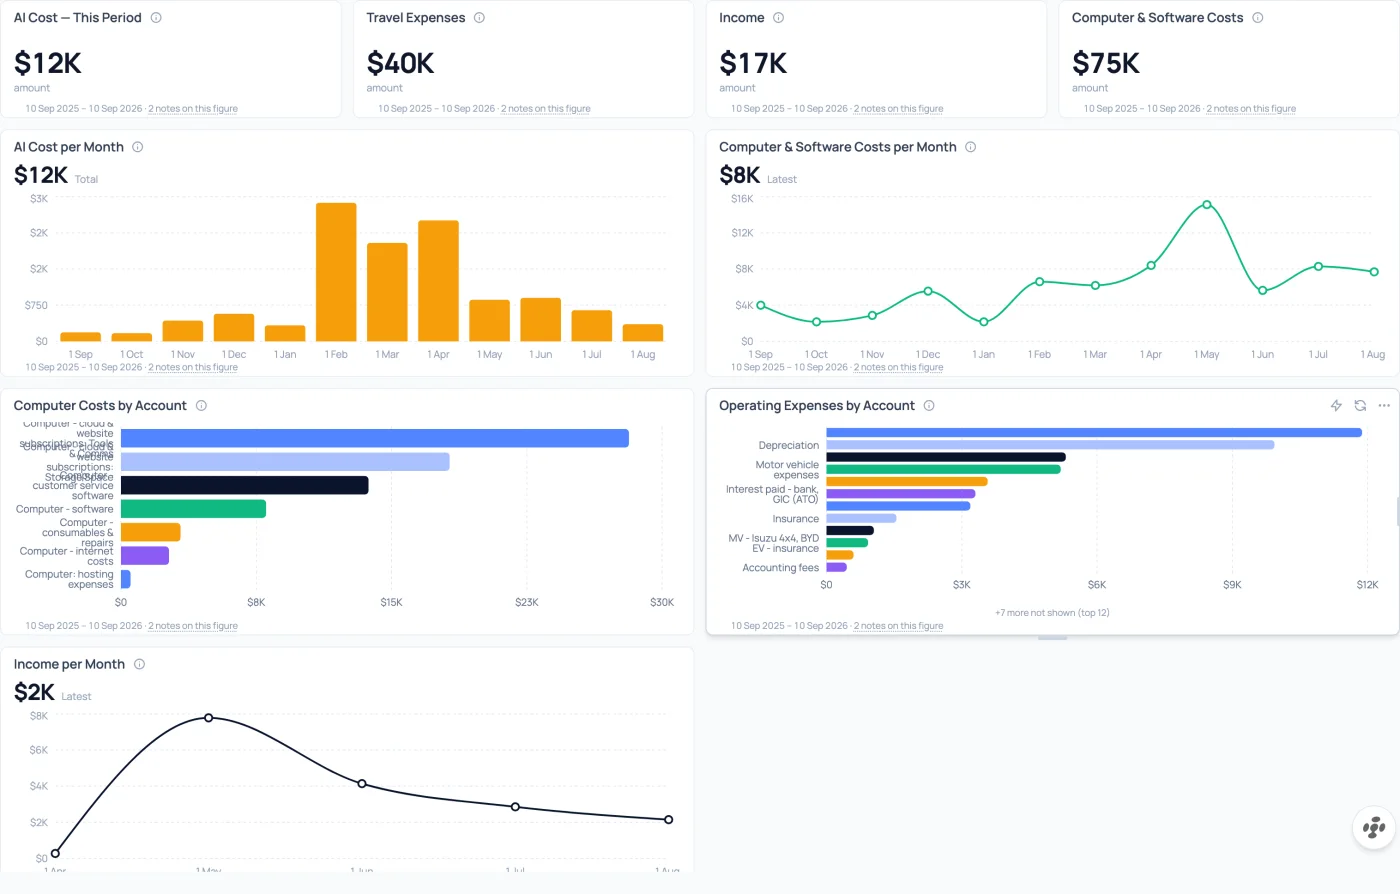
Cost monitor
Where the money goes, by category, against income. Built on accounting data read live rather than exported.
Gyms and studios
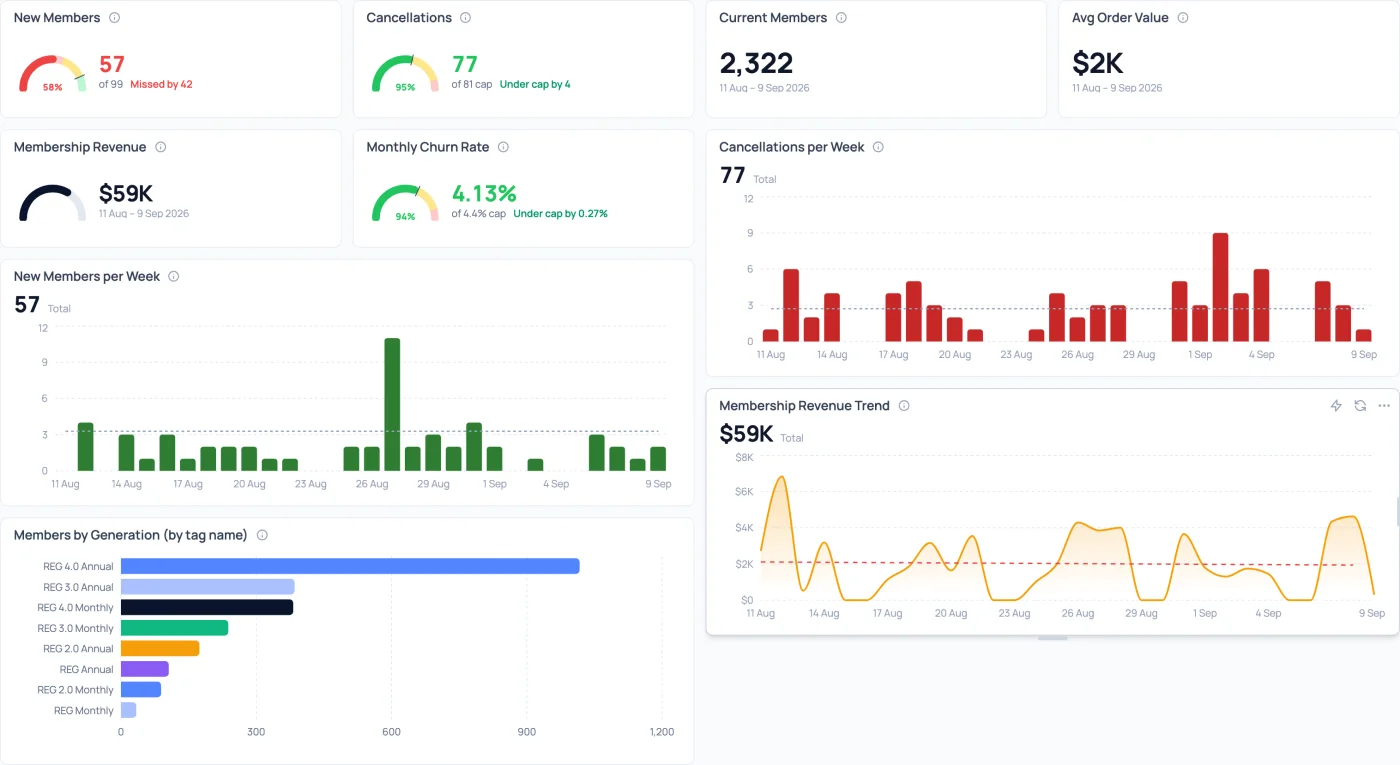
Membership growth and retention
New members and cancellations against targets, with churn under a cap and average order value beside them.
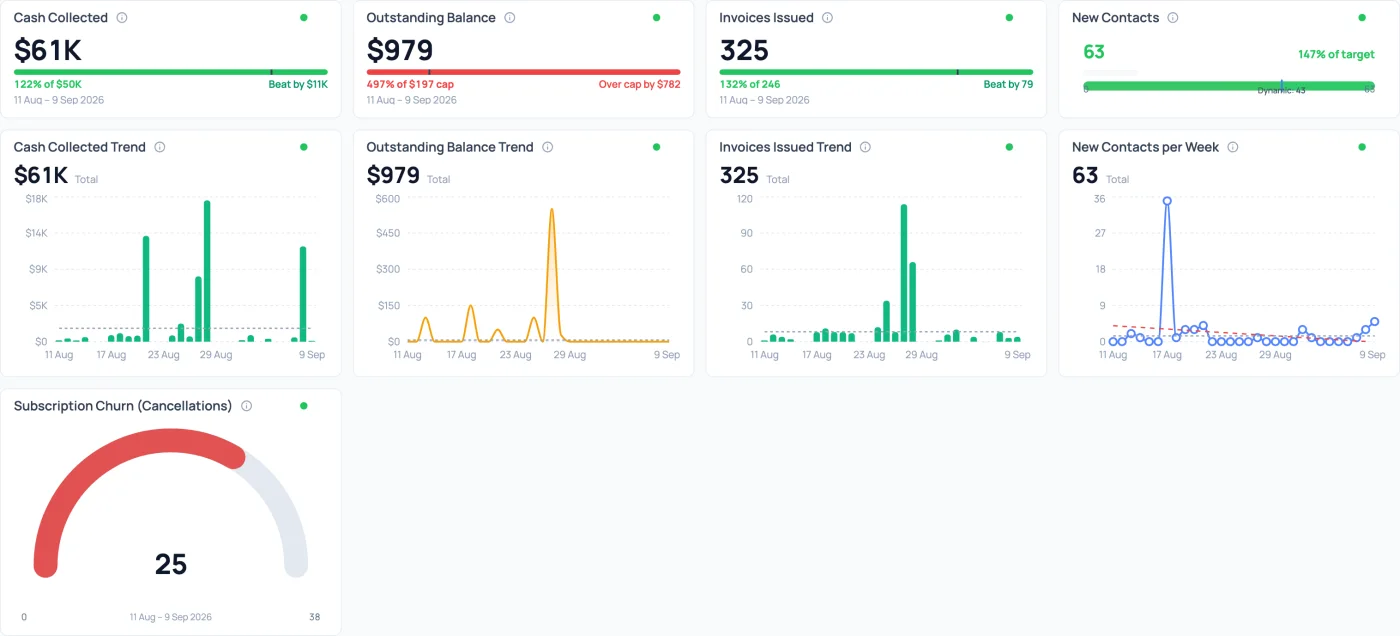
Any business
Revenue and growth
Cash collected, what is still outstanding, invoices issued and new contacts. The Monday morning four.
Every number on these boards has a receipt.
Each figure traces back to the query that produced it, so when someone asks why a number moved, the answer is in the widget rather than in somebody’s memory. That is the difference between a chart and a number you can act on.
These are live accounts. Boards like them take minutes to build, either by hand or by asking the analyst and approving its plan before it builds anything.
Want yours in here?
We build the first board with you on a demo. If it turns out well, we will ask before showing it.